Company - Digital Youth Network
The Digital Youth Network (DYN) was founded in 2005 by Dr. Nichole Pinkard and Akili Lee as a research lab dedicated to cultivating agency in young people through digital literacy. DYN builds tools and programs to prepare youth with the digital and computational skills needed to design and build their worlds. One of its key programs, the Digital Youth Divas, engages middle school girls from underserved communities in engineering and computer science activities to help them develop STEM identities and skills. DYN created iRemix, one of the first social learning networks focused on out-of-school time, designed to connect students in both formal and informal settings. Through the platform, youth and adult mentors can share ideas, upload media projects to receive feedback, and critique each other's work.
DYN's iRemix Platform
Digital Youth Network created iRemix, one of the first social learning networks focused on out-of-school time, designed to connect students in both formal and informal settings. The learning tool that leverage social networking and digital media engagement to empower the youth to explore their interests. Users can share and critique media, earn badges, engage in forums and discussions, create interest driven groups, and more. Educators are able to leverage the interaction templates provided by the social network to model new ways for learners to engage with content and each other.
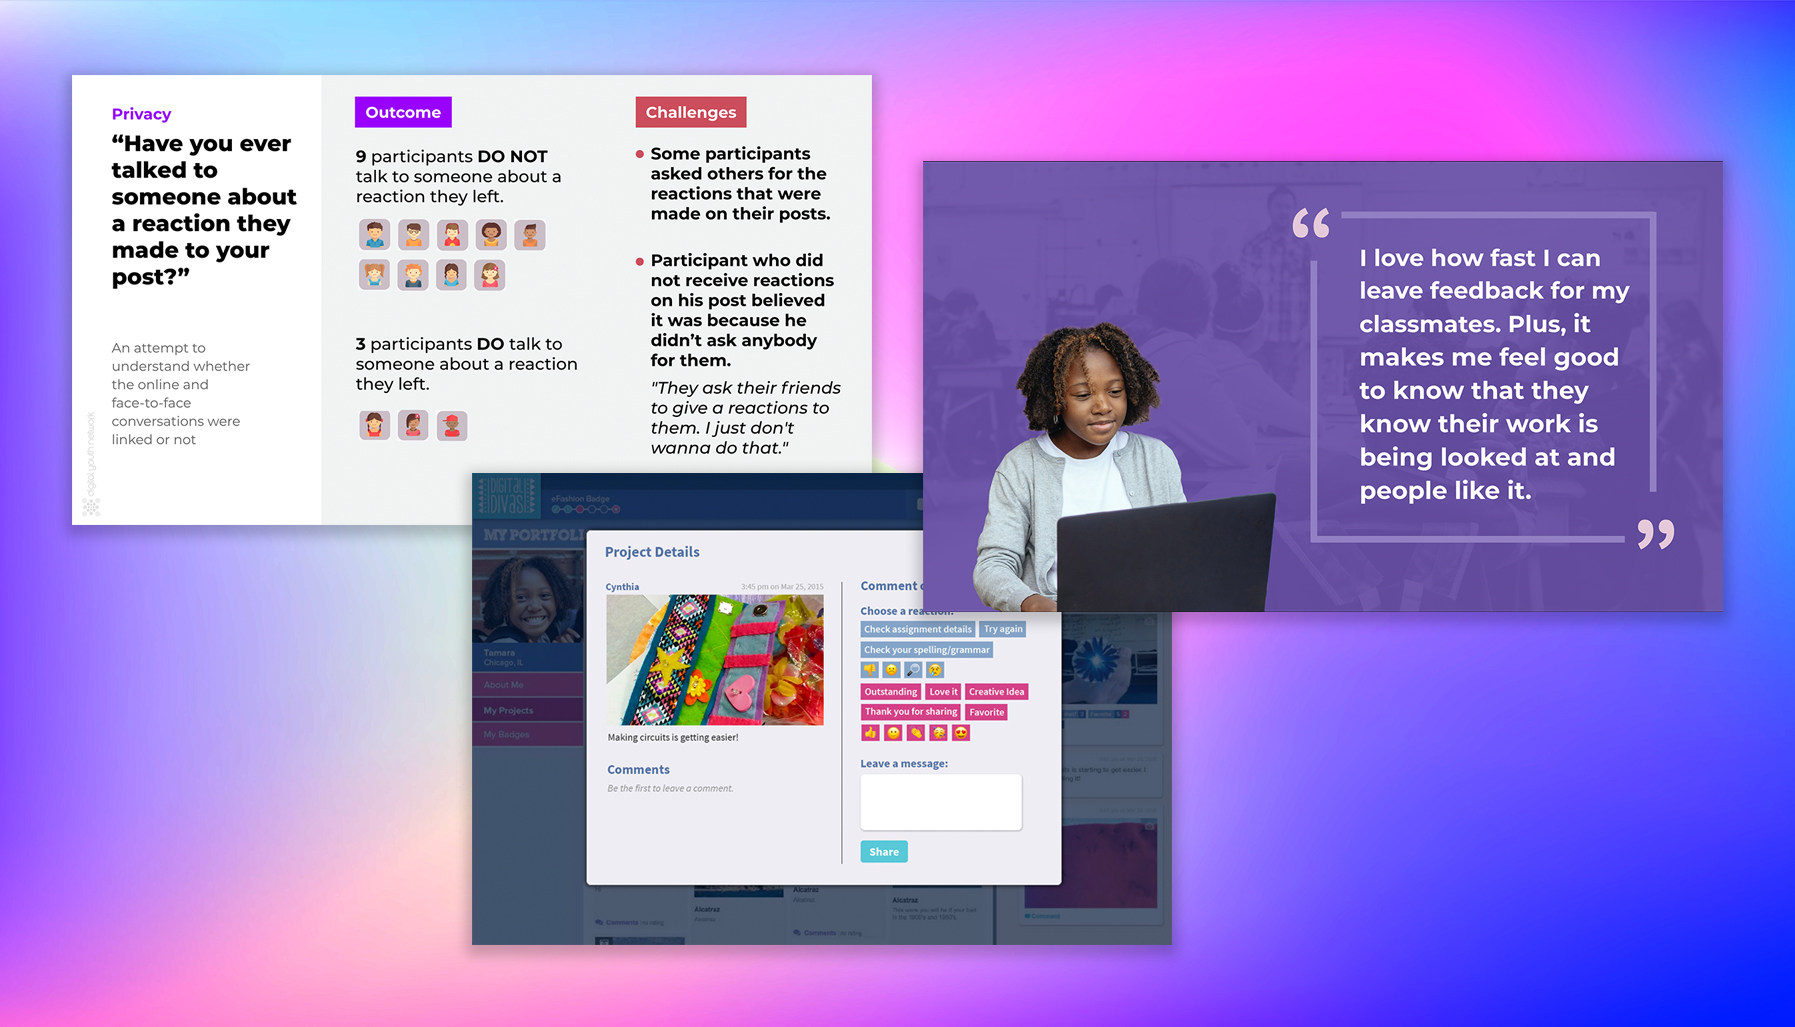
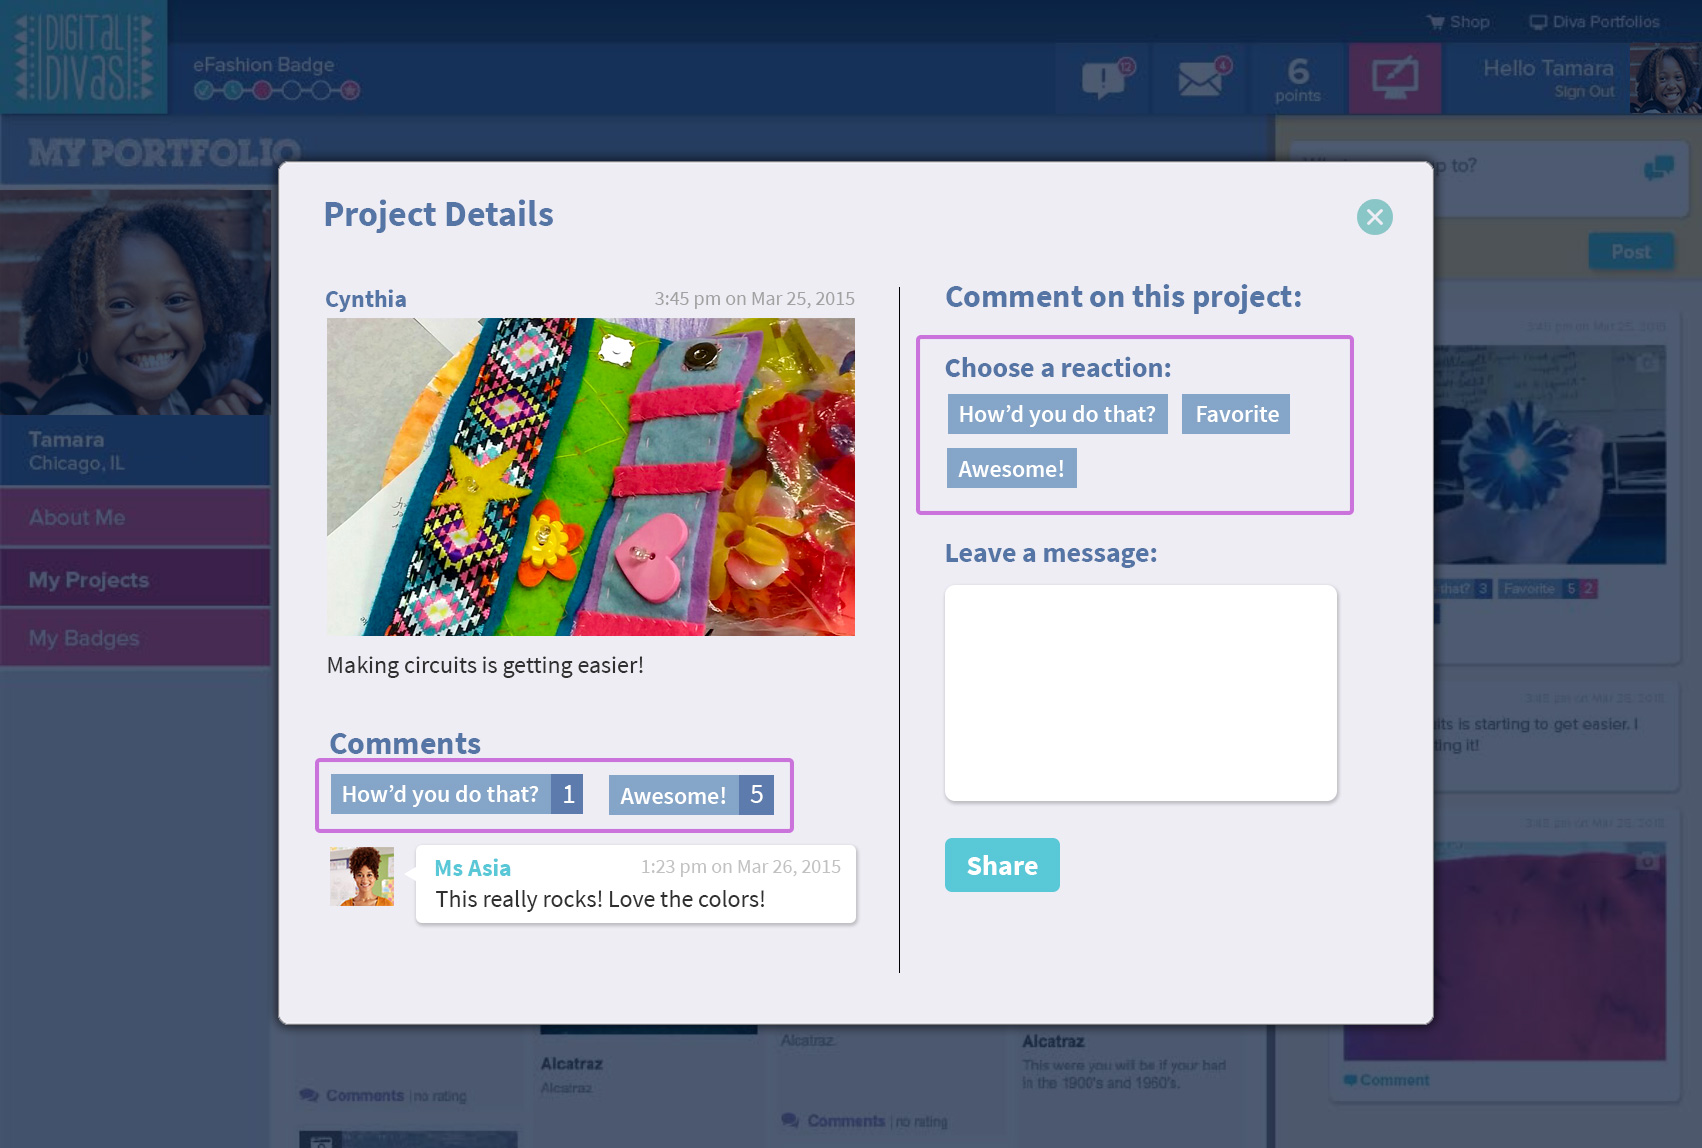
iRemix had released a Reactions feature that enables users to engage with their peer's published work by leaving a quick point of feedback through the click of a button. UX Researchers at the Digital Youth Network decided to revisit the Reactions feature in an attempt to:
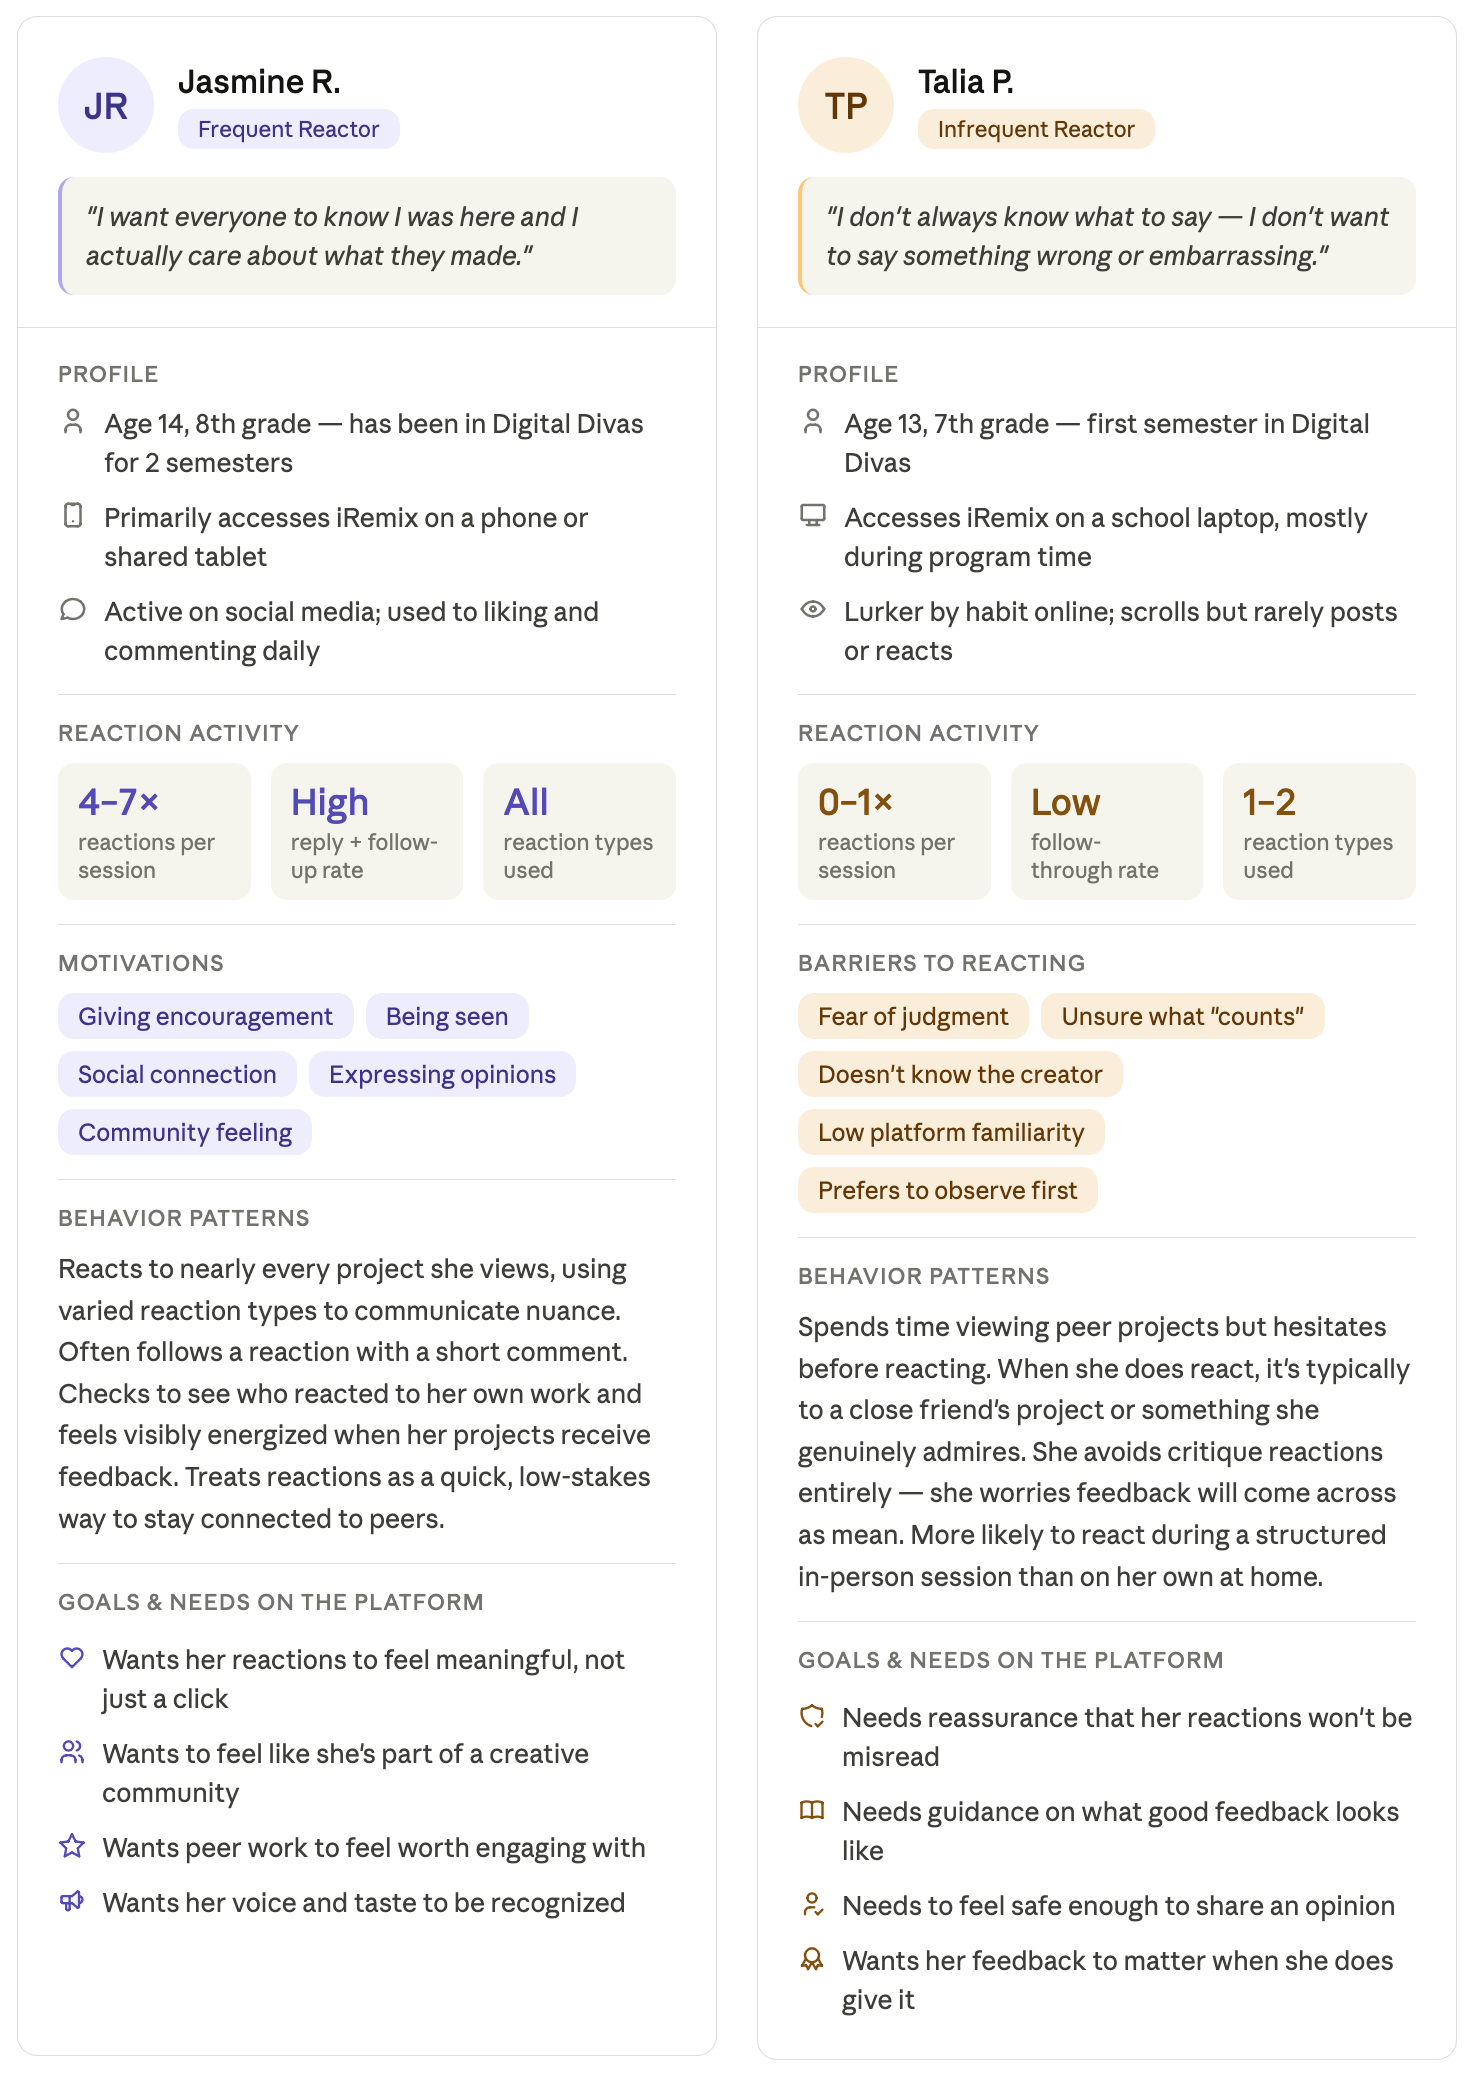
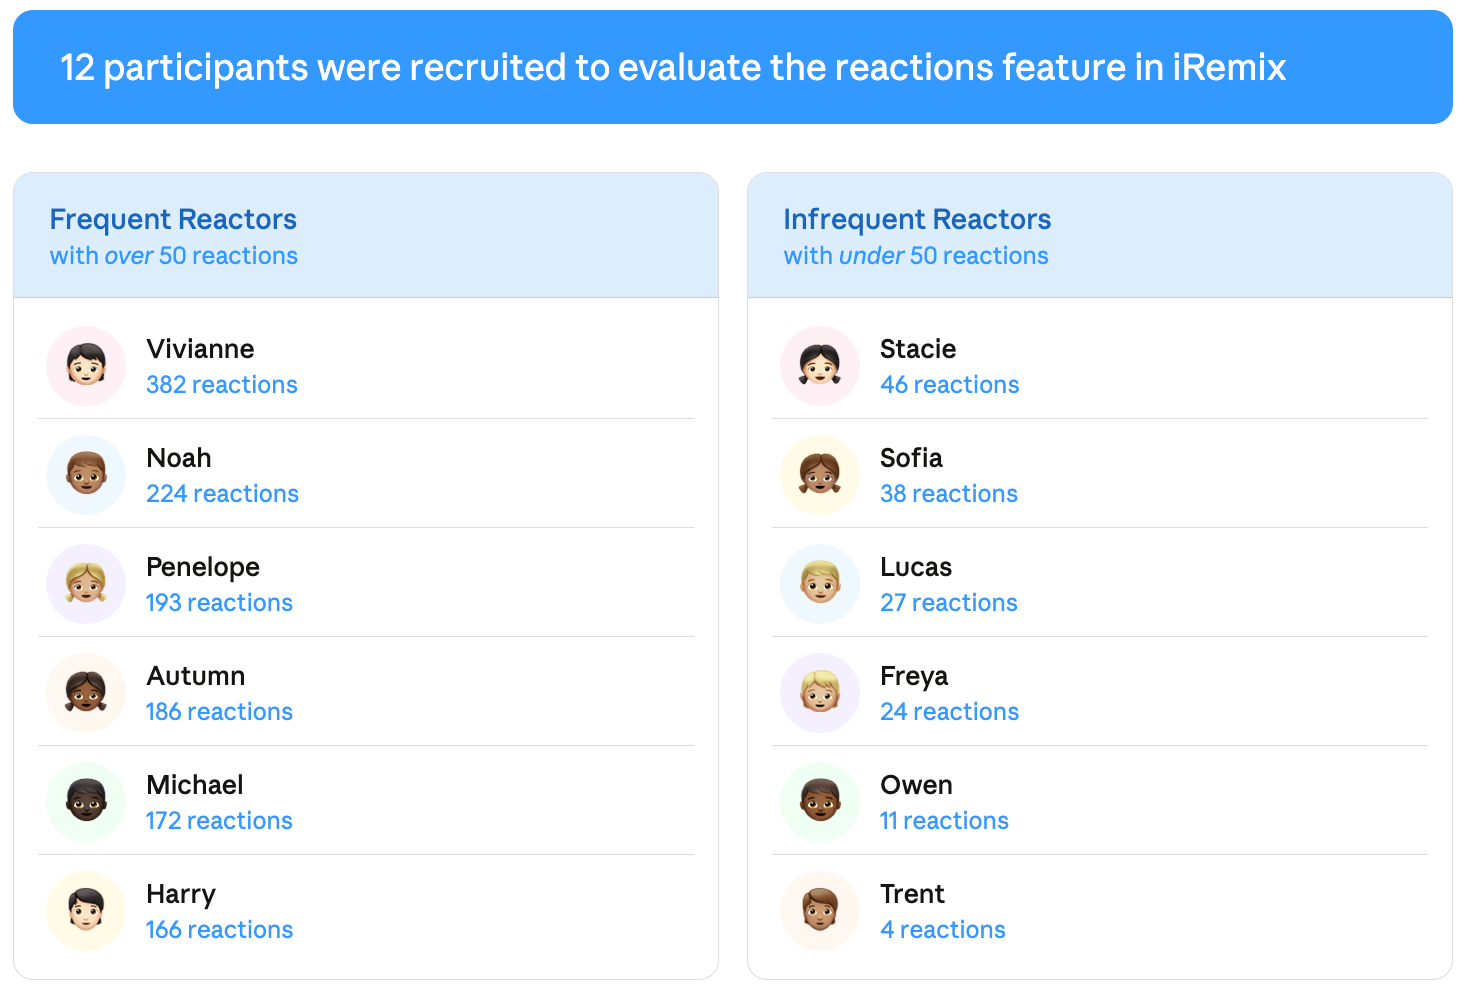
For the study, 12 participants were recruited by to understand the reactions feature in iRemix. The UX Researchers at Digital Youth Network recruited 6 participants who were coined as ‘frequent reactors’ which had over 50 total reactions and 6 participants who were ‘infrequent reactors’ which had under 50 total reactions. The individuals who met the criteria were determined via Tableau using our iRemix system log data.
All usability tests were conducted at [Middle School] over the course of one day in two separate rooms with 2 moderators present at each location. Each participant was equipped with a MacBook Air with Quicktime running in the background to record audio and video screen actions. The participants were not recorded themselves, only their voices and actions on the computer.
The moderator discussed the general goal of the test, which was to identify usability issues around the reactions feature and to understand how users navigate iRemix. Each moderator made sure that the participants understood that it is not a test and that they could stop at any time if necessary.
Once the participants were clear about the expectations and procedures of the usability test, the moderator asked the participant a series of preliminary questions. Afterwards participants were asked to complete a set of tasks and to talk aloud as they completed them. Moderators refrained from coaching the participant through tasks unless absolutely necessary.
Following the task portion of the usability test, the moderators also asked about any past issues or if they had any recommendations for reactions.

Next came the fun part — analyzing the data captured! I divvied up the 12 usability tests with another research assistant and we got down to business. Since the data was comprised of audio recordings, text scripts, and screen recordings, we found that utilizing Google Sheets would be the best way for us to go about collaborate and analyze the captured data in real time.
Participant by participant, we captured a brief summary and supporting quotes of each answer given to every question, with supporting direct quotes when applicable or impactful. Interestingly enough, we also recorded any emotions that were displayed in their voice as they answered the usability questions. This was probably one of the most eye opening pieces to this analysis due to the fact that at times there was a conflict between an answer given and one's emotion through their voice.
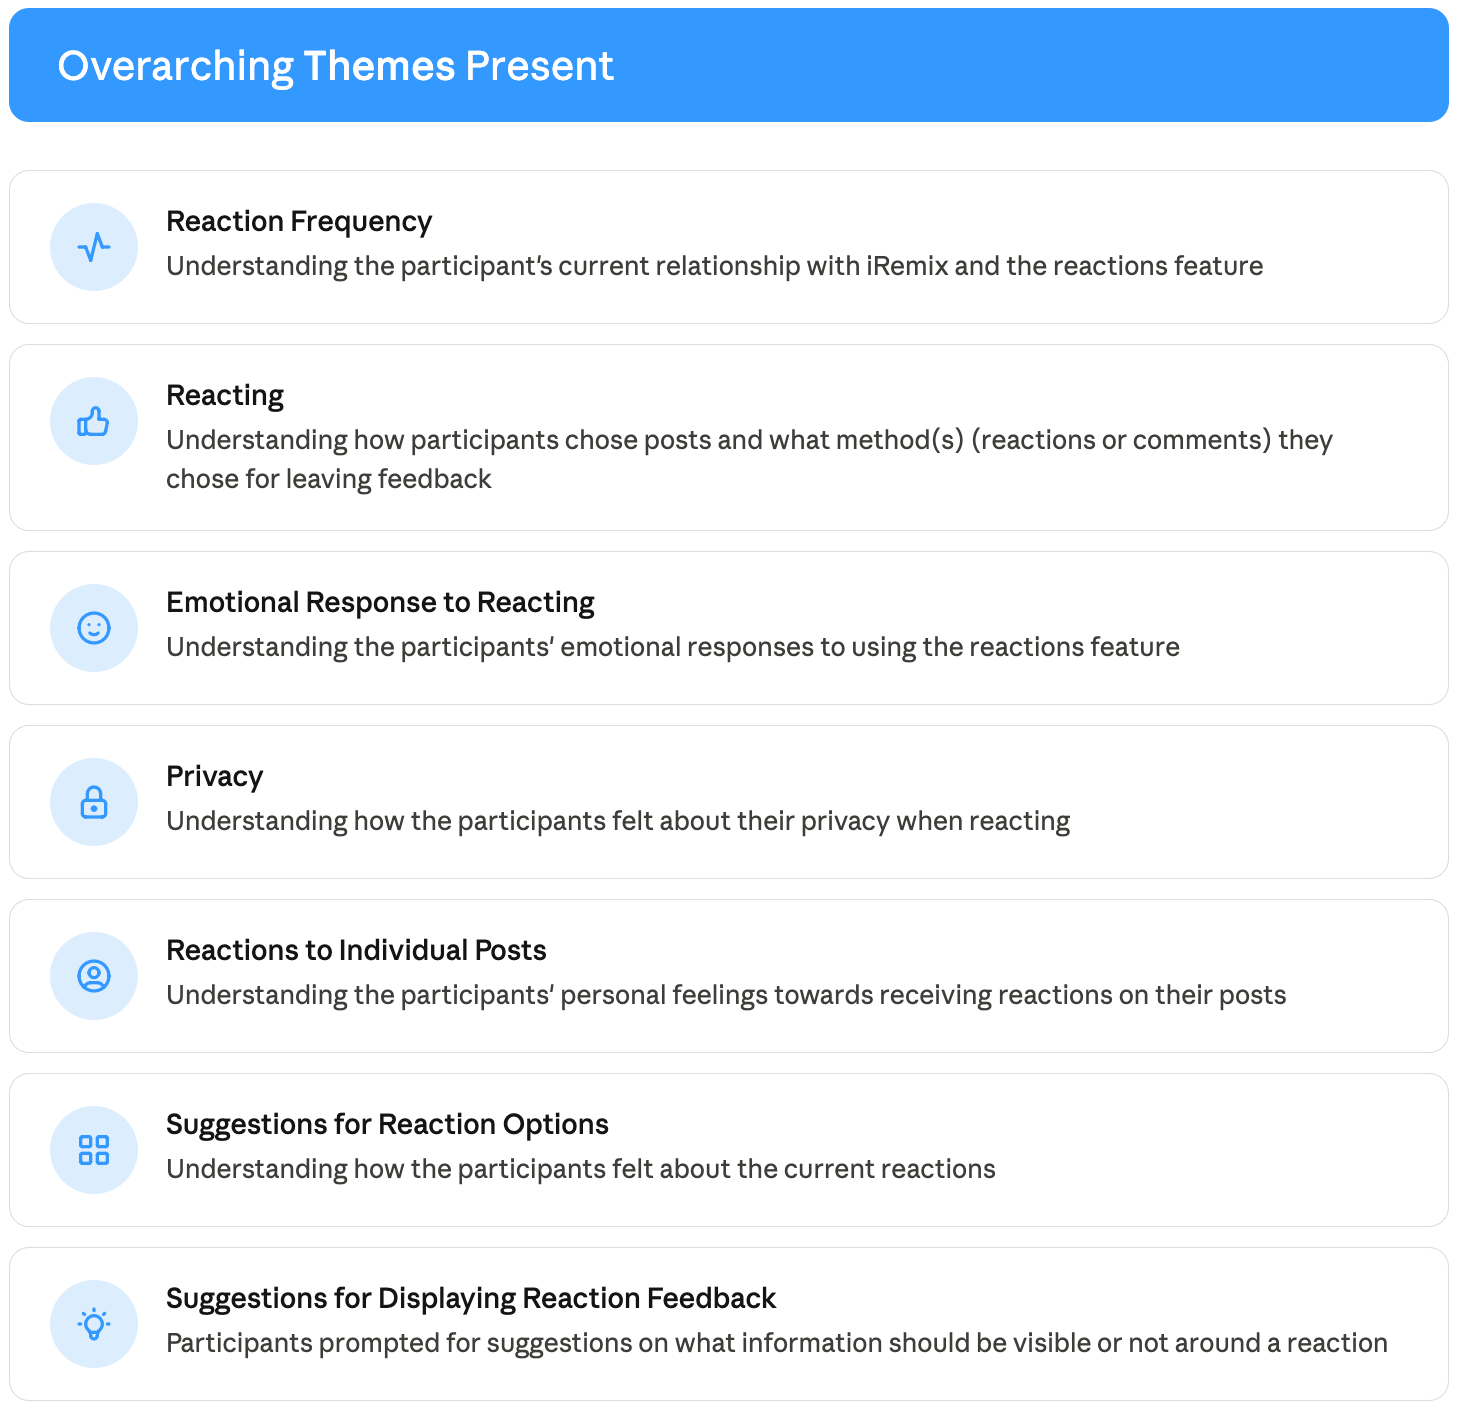
Upon completing our full analysis of the all of the responses, the next step in the process including piecing together all of the insights discovered in preparation for a written report for all members (both Educators and UX Researchers) of the DYN to consume. Prior to beginning the written report, we made the decision to create overarching themes pulled from the usability questions created by our UX Researchers. The curated themes created a story dynamic that helped engage the readers of our written report, as well as the viewers of our presentation.
Upon completing and sharing the written report with the team at DYN, I collaborated with my research assistant colleague in the creation of a Google Slides presentation filled with notable summaries, quotes, and insights found in the written report and usability test altogether. Together, we then presented our work to the Cyberlearning team.
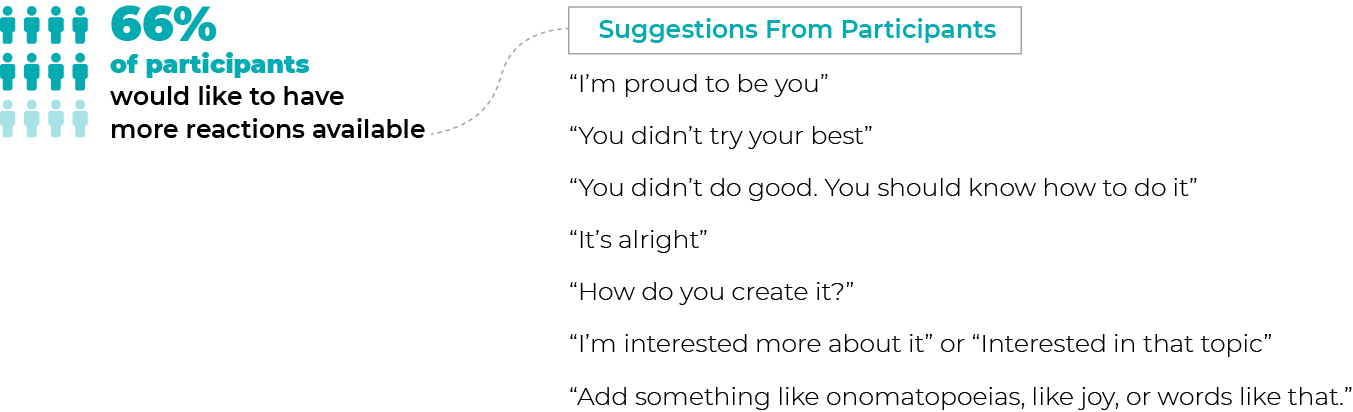
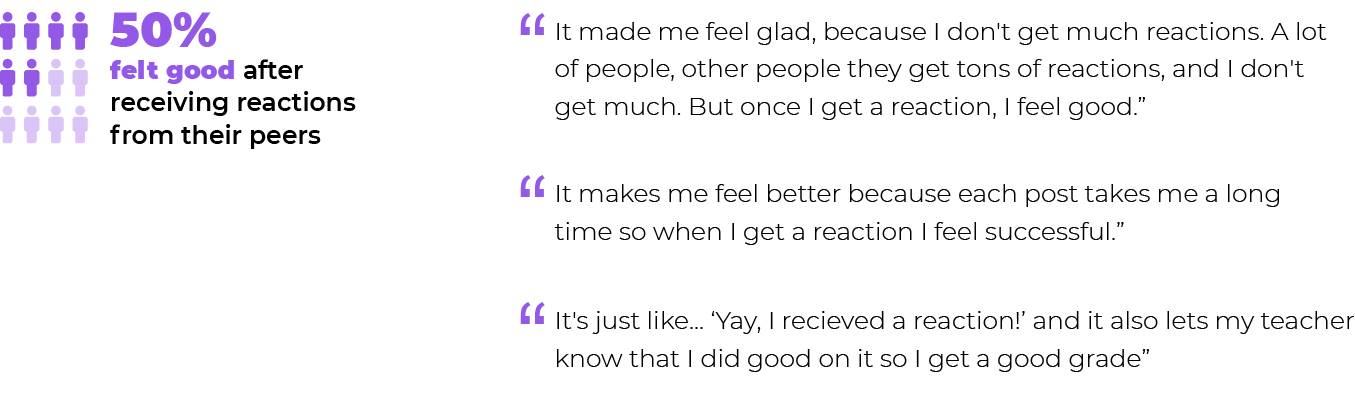
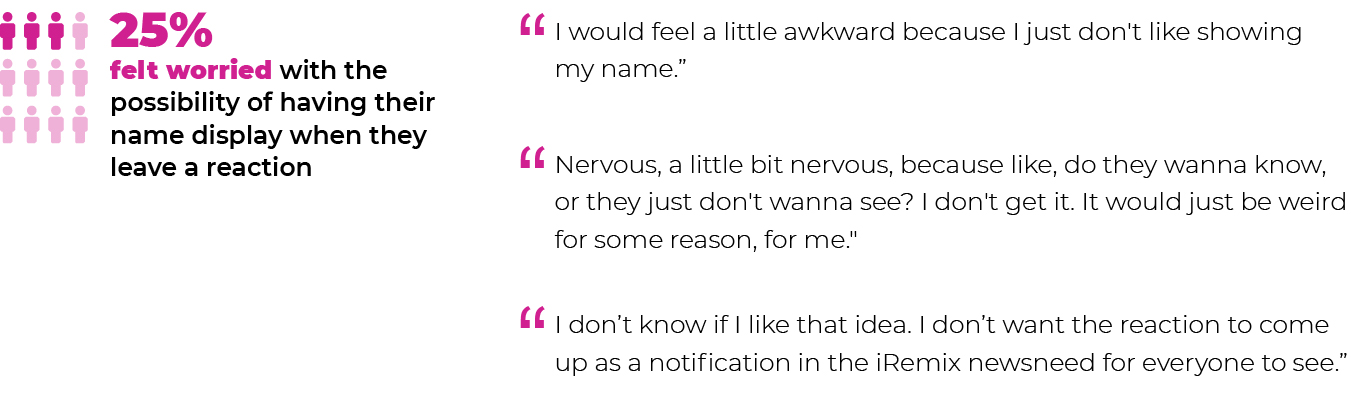
The analysis of the Reactions Usability Test was an enlightening experience into the world of UX research and real life user data. In the past, I had conducted usability tests in classes while at DePaul, but never had I collected data to that extent. Over the span of a few weeks, I quickly realized that there needs to be a deep understanding of the data collected in order to truly summarize and present findings. Research, at times, requires the ability to read between the lines and pick up on the small things that occur, such as a subtle change in tone, or a pause. In the end, the thorough analysis of the data as well as the collaboration with others demonstrated to me just how important data is in revealing insights and promoting a better user experience.
I'm a Product Designer based in Chicago with experience in delivering 0 → 1 products that meet business goals.